|
| Homepage | The model | Output | FAQ | Citing & Credits |
MCPep is based on the Monte Carlo simulation model presented in references (1, 2) and here: Calculation of ΔGSIL, ΔGimm and ΔGlip
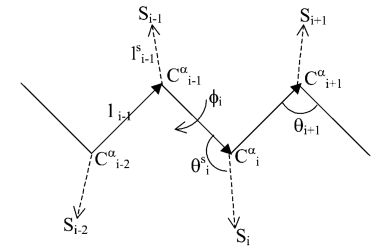
Peptide representation Each residue i is represented by two interaction sites corresponding to its α-carbon atom (Ciα) and its side chain interaction center, Si (Fig. 1) (1). These sites are selected in advance on the basis of the structure and energy characteristics of the amino acid (3). The peptide backbone is represented by virtual bonds connecting consecutive α-carbon atoms, as proposed by Flory and colleagues (4); a peptide of n residues has N-1 virtual bonds. Virtual bonds are highly stiff, and their lengths are taken here as fixed at their equilibrium values of 3.81±0.03Å. The peptide backbone conformation is defined by the 2N-5 dimensional vector [θ2, θ3, ..., θn-1, φ3, φ4, ..., φN-1] including n-2 virtual bond angles (θi) and n-3 dihedral angles (φi). The distance between Si and Ciα, as well as the side chain virtual bond vector pointing from Ciα to Si named θiS, are fixed at their equilibrium values. Thus, the conformation of side chain i is expressed by the torsion angle (φiS).
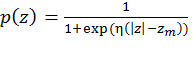
Figure 1. Schematic representation of the virtual bond model. A segment between backbone units Ci-2α and Ci+1α is shown. The site attached to the ith α-carbon is marked as Si. φi is the rotational angle of the ith virtual bond, connecting Ciα and Ci-1α. θi is the bond angle between virtual bonds i and i+1. θiS is the side chain virtual bond vector pointing from Ciα to Si. φiS is defined by Ci-2α, Ci-1α, Ciα and Si. Membrane representation The membrane is described using two parameters: hydrophobicity and surface charge. The hydrophobicity of the membrane (p) is proportional to the distance (z) between the interaction site and the bilayer midplane according to the following sigmoidal function:
Figure 2. Membrane representation. p(z) was calculated using Eq.1, with zm=15Å and η=1Å-1 (solid line). The location of the surface charge is designated by the dashed lines; the hydrophobic region of the membrane is defined by the dotted lines. Calculation of The total free energy
difference between a peptide in the aqueous phase and in the membrane (
Calculation of
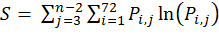
where ΔS refers to the entropy difference between the water and membrane-bound states, while the entropy (S) in each state is determined by the distribution of the virtual bond rotations in the reduced peptide representation. To this end, the rotation space of each virtual bond is divided into 72 discrete intervals of 5° each. The entropy is estimated using the familiar "P lnP" relation:
Calculation of ΔGdef is the free energy penalty associated with fluctuations of the membrane thickness around its resting (native) value. Insertion of a rigid hydrophobic inclusion into a lipid bilayer may result in deformation of the lipid bilayer such that the width of the hydrocarbon region matches the hydrophobic length of the inclusion, following the mattress model (8). The deformation involves a free energy penalty, ΔGdef, resulting from the compression or expansion of the lipid chains. Different methods have been used to calculate ΔGdef for lipid bilayers composed of lipids of various types; these methods have yielded similar values (8-14). For the MC model, the estimation of Fattal and Ben-Shaul (9) was chosen to estimate ΔGdef. Their calculations were based on a statistical-thermodynamic molecular model of the lipid chains and the fit of harmonic potential, using the following form:
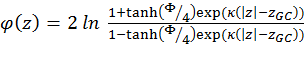
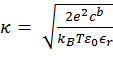
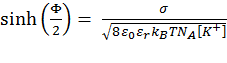
Calculation of ΔGcoul ΔGcoul stands for the Coulombic interactions between titratable residues of the peptide and the (negative) surface charge of the membrane. It is calculated using the Gouy-Chapman theory that describes how the electrostatic potential φ (measured in units of kBT/e, where kB is the Boltzmann constant, T is the temperature, and e is the electron charge) depends on the peptide's distance from the membrane surface in an electrolyte solution (15). To this end, the solution is considered neutral, containing monovalent salt. The protonation state of the side chains of the titratable residues in the solution is set according to pH = 7.
Calculation of ΔGsol, ΔGimm and ΔGlip ΔGsol is the free energy of transfer of the peptide from water to the membrane. It accounts for electrostatic contributions resulting from changes in solvent polarity, as well as for nonpolar (hydrophobic) effects, which result both from differences in the van der Waals interactions of the peptide with the membrane and aqueous phases, and from solvent structure effects. ΔGimm is the free energy penalty resulting from the confinement of the external translational and rotational motion of the peptide inside the membrane. ΔGlip is the free energy penalty resulting from the interference of the peptide with the conformational freedom of the aliphatic chains of the lipids in the bilayer while the membrane retains its native thickness. The sum of ΔGsol, ΔGimm and ΔGlip is denoted as ΔGSIL, and in the MC simulations it is calculated by summing over the contributions of the individual amino acids. The free energy of transfer of a specific residue i, i.e., ΔgSIL_i(z) can be decomposed into contributions from its backbone ΔgbSIL and side chain ΔgsSIL. Thus, ΔGSIL can be determined according to the following:
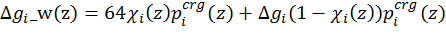
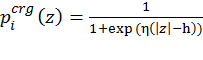
The prefactors in the two terms ( Δgis are calculated using the Kessel and Ben-Tal hydrophobicity scale (Table 1) (5). The scale accounts for the free energy of transfer of the amino acids, located in the center of a polyalanine α-helix, from the aqueous phase into the membrane midplane. In order to avoid the excessive penalty associated with the transfer of charged residues into the bilayer, in the model the titratable residues are neutralized gradually upon insertion into the membrane, so that a nearly neutral form is desolvated into the hydrophobic core. However, as described above, a gradual transition between the charged and neutral forms of titratable residues based on χi(z) (Eq.11) is introduced into the model. Therefore, for the neutral state of a titratable residue Δgis is derived from the hydrophobicity scale (Table 1); for the charged state of a titratable residue Δgis is taken as 64 kT (16):
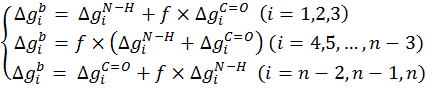
where f is proportional to backbone deviations from the optimal α-helical conformation as observed by Bahar and Jernigan (3). It is assigned a value of zero for residues in their ideal α-helical conformations obtained at φ0=-120° (7); for these residues, the C=O and N-H backbone groups neutralize each other. The value of 1 is assigned to f for residues deviating significantly from the ideal α-helical conformation, e.g., residues that are in extended conformations. For these residues the free-energy penalty due to the transfer of both the C=O and N-H backbone groups are taken into account:
It is noteworthy that the stretches of three residues at the N- and C-termini are treated differently than the peptide core (Eq. 17). The free energy penalty associated with the transfer of the uncompensated hydrogen bonds of the N-H groups of the three residues at the N-terminus is taken into account regardless of the peptide conformation. Likewise, the free energy penalty due to the transfer of the uncompensated hydrogen bonds of the C=O groups of the three residues at the C-terminus is also taken into account, regardless of the peptide conformation.
Table 1. A hydrophobicity scale representing free energies of transfer of each of the 20 amino acids from water into the center of the hydrocarbon region of a model lipid bilayer (ΔgSIL_i). The scale was computationally derived, as described in Kessel and Ben-Tal (2002) (5). The amino acid residues are presented using a single letter code. The values include the free-energy penalty due to the transfer of the backbone hydrogen bond from water into the membrane. The last two rows present an extra free-energy penalty associated with the transfer of unsatisfied backbone N-H and C=O hydrogen bonds from water to the membrane. (back to top)
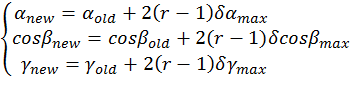
Generation of conformations New conformations are generated by simultaneous random perturbations of φi, θi, φis:
The peptide configuration is changed by external motions as described below. However, it is noteworthy that a set of randomly chosen conformational changes could also lead to slight changes in the peptide's orientation in the membrane. (back to top)
Generation of configurations External rigid body rotational and translational motions arre carried out to change the peptide's configuration, i.e. its location in, and orientation with respect to, the membrane. These motions are represented respectively by:
Additionally, the width of the membrane's hydrophobic region is perturbed:
Sampling To calculate the free energy difference between a peptide in the aqueous phase and the peptide in the membrane (Eq. 2), peptide simulations in water and in membrane environments are performed. A standard MC protocol is employed, and acceptance of each move is based on the Metropolis criterion and the free energy difference between the new and old states (18). In water, peptides are subjected solely to internal conformational modifications. In one MC cycle the number of internal modifications performed is equal to the number of residues in the peptide. Therefore, the acceptance criterion is based on ΔΔE (Eq. 3). In the membrane, each MC cycle includes additional external rigid body rotational and translational motions as described above. Thus, the acceptance criterion in this case is derived from the following free energy difference:
References 4. Flory, P. J. 1969. Statistical Mechanics of Chain Molecules. Wiley-Interscience, New-York. |