|
| Homepage | The model | Output | FAQ | Citing & Credits |
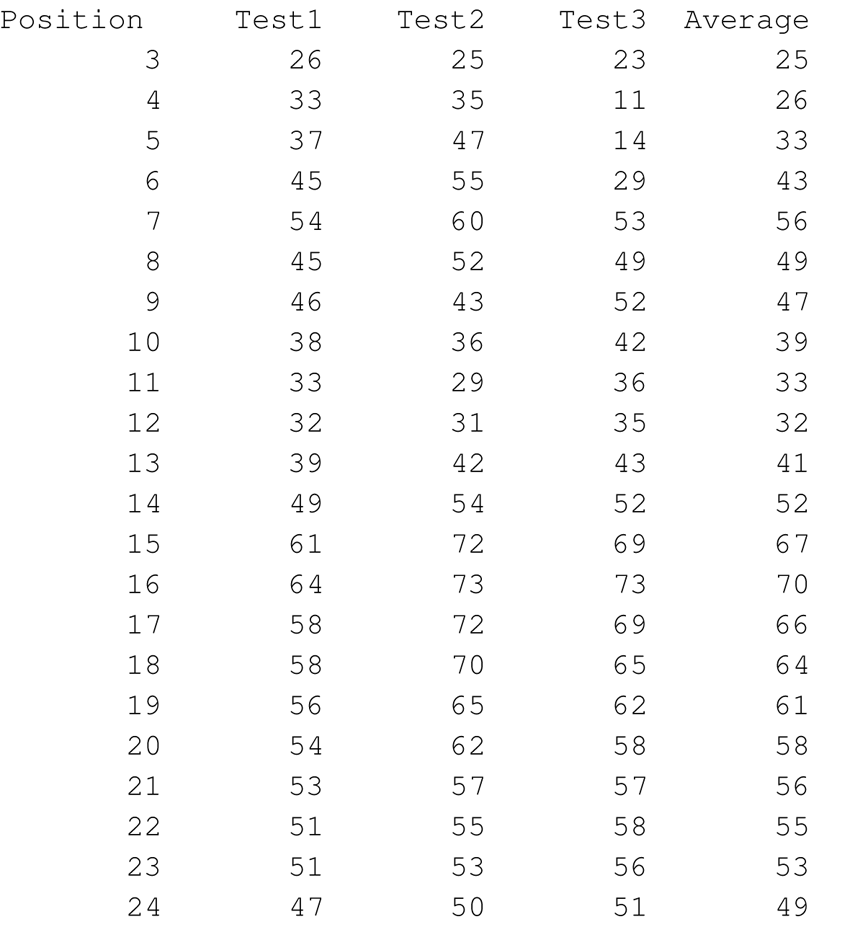
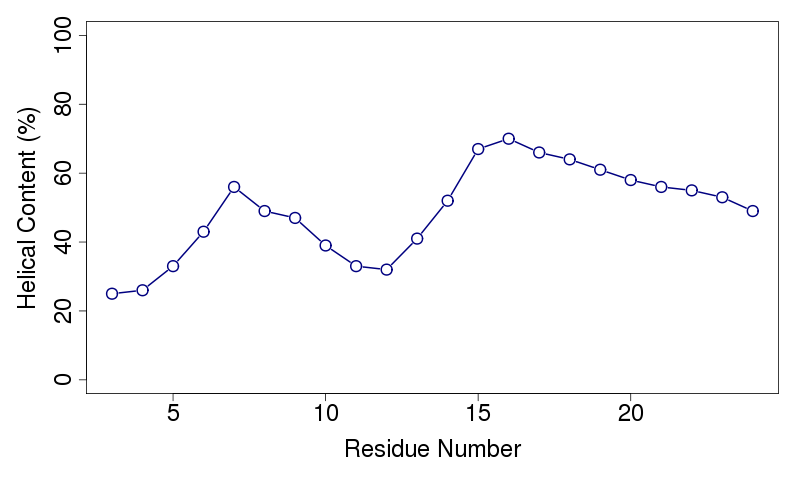
Aqueous phase simulationsThree simulations, 500000 cycles each, are performed in water. The output files include the peptide's helical content and example simulations along the x-z and y-z planes.Helical contentThe helical content of the peptide is calculated based on the conformations obtained from the simulations. A residue is defined to be in an α-helical region if the rotational angles of its two adjacent bonds lay within the interval typical for an α-helix (-120°±30°)(1). The percentage of conformations where a residue is found in the helical state is calculated and presented in the output files. The rotational angles of the peptide's ends cannot be defined, and the two residues at the N-terminal and the two residues at the C-terminal are neglected. An example helical content (in %) data file, taken from the simulations of melittin in water, is shown on the left. The 1st column shows the amino acids' position in the sequence; columns 2-4 show the helical content from simulations 1-3, respectively. The last column is the average of the three simulations, used for the graphical presentation shown on the right.
Example simulationsOne of the three simulations in water is presented. Here is an example simulation of melittin along the x-z (left) and y-z (right) planes. Residues' types are designated in circles. The hydrophobic residues (A, G, F, I, L, V) are in orange, charged residues (K, R, E, D) are blue, and the polar residues are green. Unfortunately, animated gifs are not possible to pause or stop. Windows Media Player or free softwares like Irfanview can be of used for it.
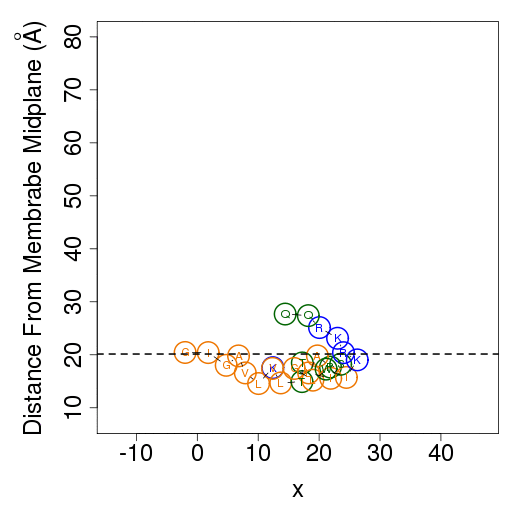
Membrane simulationsThe output files from membrane simulations are starting configurations, peptide's helical content, membrane association free energy decomposition of the predicted favorable orientation relative to the membrane, average orientation and example simulations. The helical content is calculated as in water simulations.Starting configurationsMembrane simulations starts from two different orientations of the peptide. In the first the peptide is placed in parallel to the membrane normal, i.e. transmembrane configuration; in the second the peptide is positioned on the membrane surface. The figures of the starting configurations are presented as output files in the x-z and y-z (below) planes. Residues' numbers in the sequence are designated in circles. The horizontal dotted line represents the location of the phosphate group of the lipids polar heads.
Membrane association free energy decompositionConformations obtained from all membrane simulations are divided into surface and transmembrane. The free energy of membrane-association is then calculated. Based on that, the preferred orientation of the peptide in the membrane is determined. In some cases both surface and transmembrane orientation can be favorable, i.e. with negative values of the free energy of membrane association. In such case, all output files are provided separately for surface and transmembrane orientations. The free energy of membrane-association and decomponent are shown in the output file:
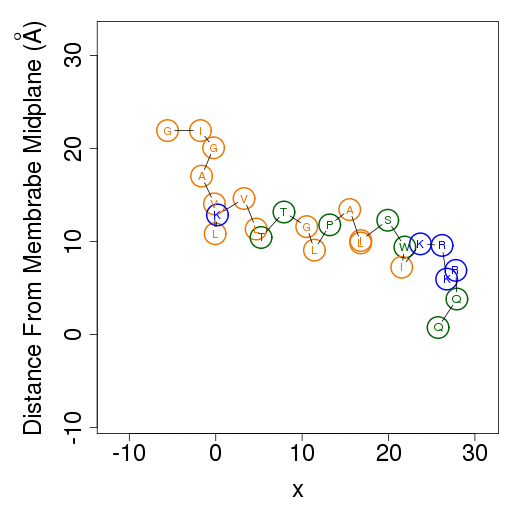
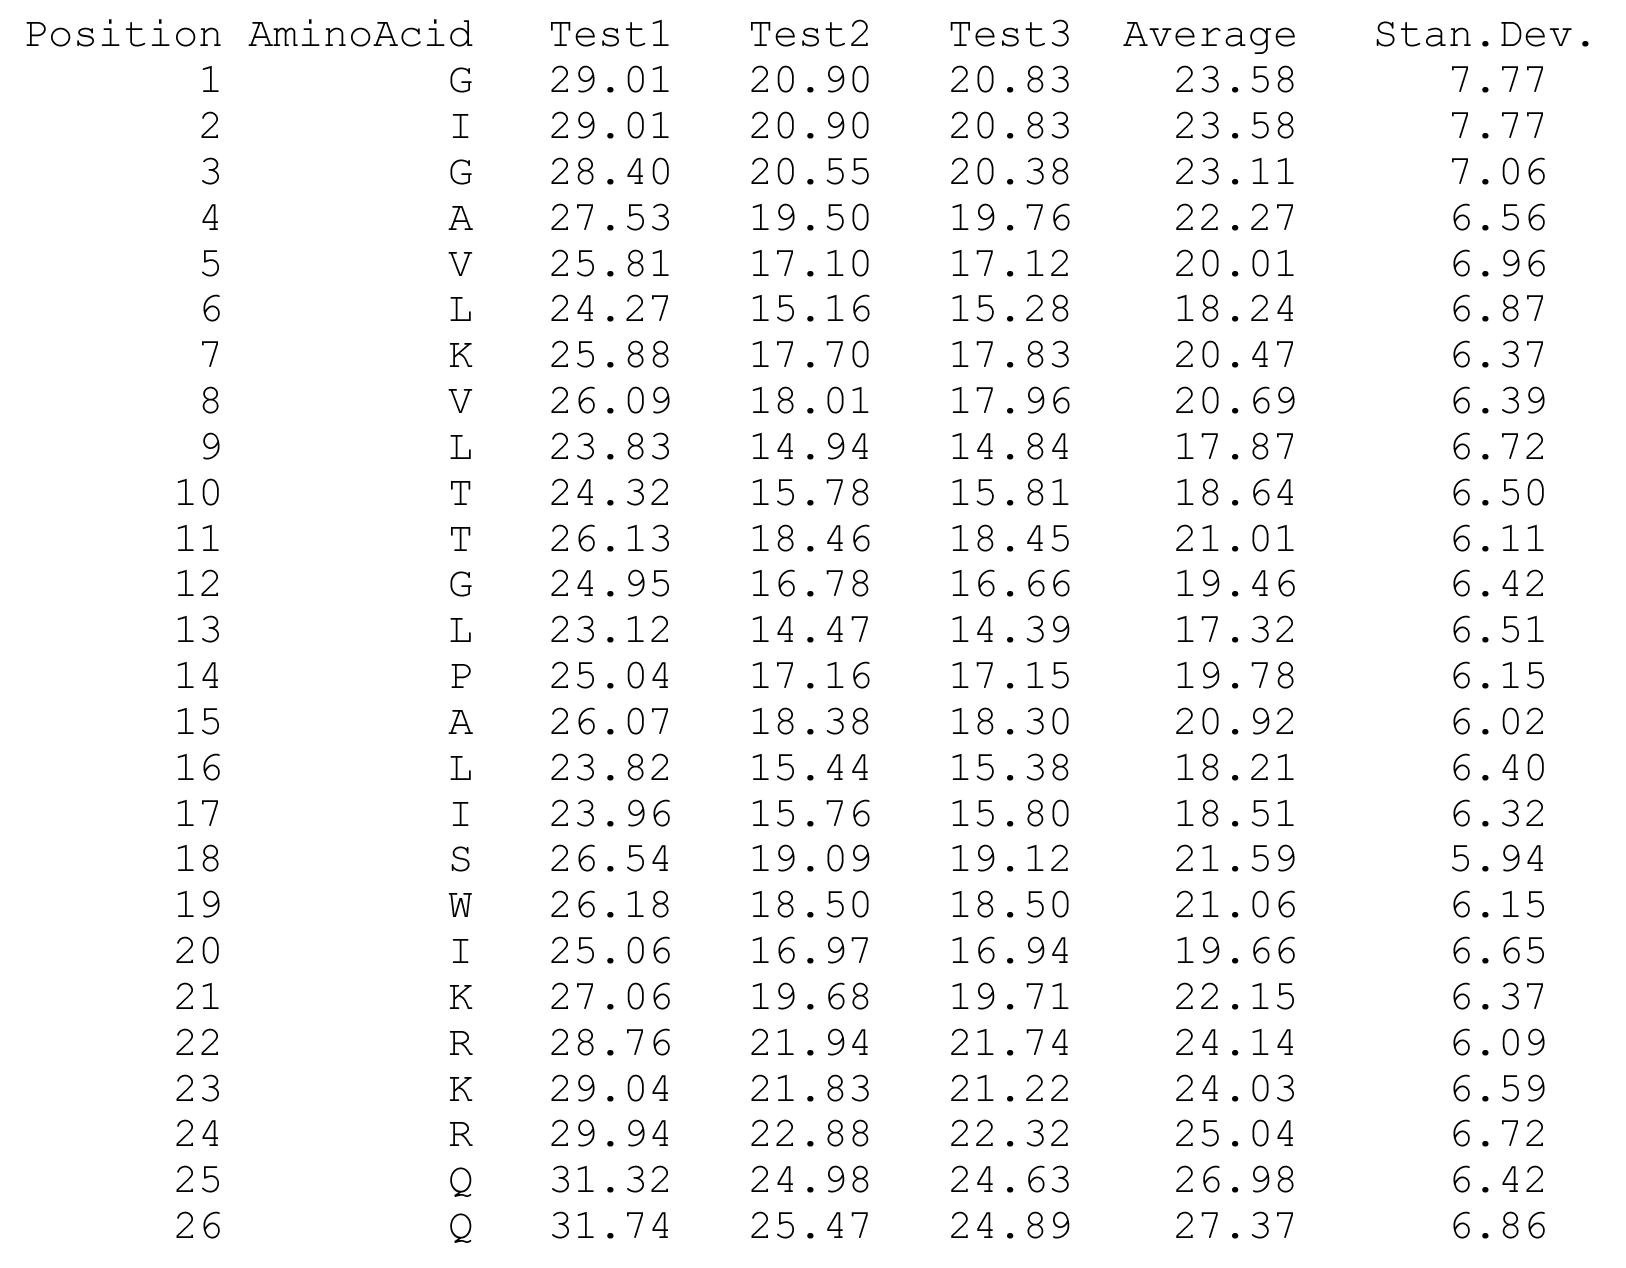
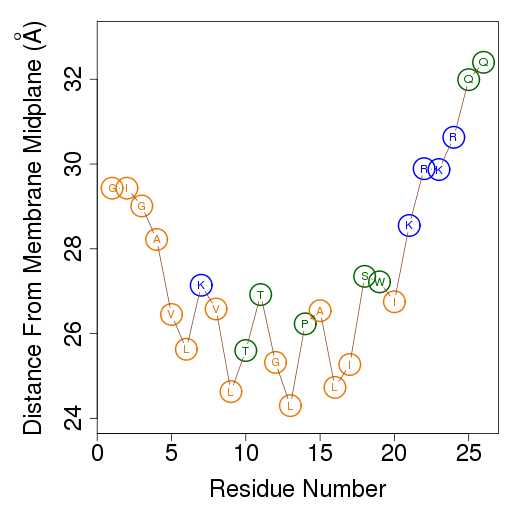
The columns are as follows (more detailed description of energetic terms is provided here): Test - test number. dGTotal - total free energy difference between the peptide in the aqueous phase and in the membrane. dGConf - free energy change due to membrane-induced conformational changes in the peptide. TdS - the contribution of the entropy term. dEint - internal energy changes between the water- and membrane-bound states of the peptides. dGSIL - includes three terms, i.e., dGsol, dGimm, dGlip. DGsol is the free energy of transfer of the peptide from the aqueous phase into the membrane. It takes into account electrostatic contributions resulting from changes in solvent polarity, as well as nonpolar effects, both resulting from differences in van der Waals interactions of the peptide with the membrane and aqueous phases and from solvent structure effects. DGimm is the free energy penalty resulting from the confinement of the external translational and rotational motion of the peptide inside the membrane. DGlip is the free energy penalty resulting from the interference of the peptide with the conformational freedom of the aliphatic chains of the lipids in the bilayer while the membrane retains its native width. dGSILbb - backbone contribution to dGSIL. dGSILsc - sidechain contribution to dGSIL. dGdef - free energy penalty associated with fluctuations of the membrane width. dGcoul - electrostatic interactions between titratable residues of the peptide and membrane surface charge. Mwidth - average membrane width. Zcenter - average distance from the membrane midplane. In our model the Z-axis is in parallel to membrane normal, and the origin coincides with the membrane midplane. Tilt - the angle between the N'-to-C' vector of the helical part of the helix and membrane normal. N - number of conformations. Lines 2-4 are results from the three tests; line 5 contains the average values from all simulations; line 6 contains standard deviation (s.d.) values. These values are expected to be relatively large and indicate the sampling of the conformational space during the simulations. In contrast, the standard error (line 7, s.e.) should be small. Favorable orientation relative to the membraneAn example data file, taken from melittin simulations in the membrane, is shown on the left. It contains the average distance from the membrane midplane for each residue. The 1st column shows the amino acids' position in the sequence; the 2nd column shows the residue type; columns 3-5 show results from the three simulations; columns 6&7 are the average and standard deviation over the three simulations. The orientation graph (on the right) is based on the average orientation. Residue type is designated in circles. Hydrophobic residues (A, F, G, I, L, V) are orange, charged residues (K, R, E, D) are blue, and polar residues are green. The horizontal dotted line marks the location of the phosphate groups of the lipid polar heads.
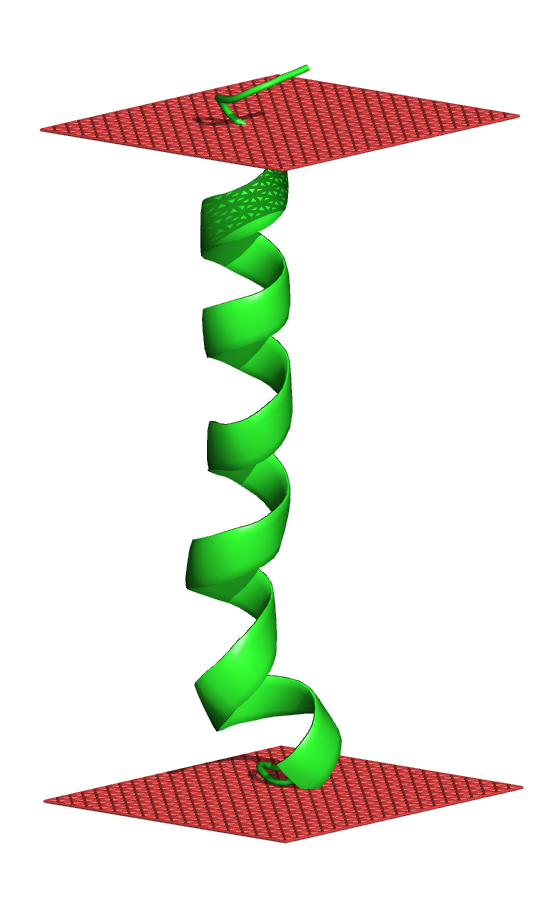
ClusteringThe conformations obtained from the simulations are clustered using the root mean square deviation (RMSD) cutoff provided by the user. All the clusters with 50 conformations or more are considered significant, and their centroid conformations are provided (in pdb format). The centroid conformations are shown in association with the membrane; the horizontal red planes mark the location of the phosphate groups of the lipid polar heads. Moreover, the free energy and its components are calculated and presented for the significant clusters.If no significant clusters are found, the RMSD cutoff is automatically increased by 1 Å, and the conformations are clustered again. The procedure is repeated until at least one significant cluster is found, or when the RMSD reaches an upper limit of 6 Å.
Example simulationsOne of the membrane simulations is presented. Here is an example simulation of melittin along the x-z (below) and y-z planes. Residue type is designated in circles. Hydrophobic residues (A, F, G, I, L, V) are orange, charged residues (K, R, E, D) are blue, and polar residues are green. The horizontal dotted line marks the location of the phosphate groups of the lipid polar heads in each frame. Unfortunately, animated gifs are not possible to pause or stop. Windows Media Player or QuickTime player can be of use for it.
|